10 August 2022 Valeria Giannelli
Journal of Experiences
A research project to profoundly understand how the size of the screens impacts the experience of viewing video content.
Year after year, mobile phones with screens increasingly similar to those of a tablet are becoming more and more common. The same goes for televisions and PC screens. A question arises: why does everything have to be so big? When we watch something on our smartphone and then watch it on a TV screen, does our experience change? If so, how?
To answer this question, we involved people in a research project and, thanks to their involvement, we collected valuable data to design better experiences.
Because emotional intensity is not enough
How the size of screens affects the use of content and, in particular, what the effect is on people’s implicit responses, has always been a subject of great interest.
In fact, from 2000 to today, the use of various devices to access the internet has drastically increased. Nowadays people can inform themselves through smartphones, laptops, TVs, and more. The vast availability of devices has obviously impacted how people access information, with consequences on the way companies and people come into contact with each other.
It is therefore automatic to think of the emotional aspects in advertising campaigns which have been analysed under a critical lens since the 1980s (Batra 1986, Caferata and Tybout forthcoming; Holbrook and O’Shaughnessy 1984) and which were followed by studies to see the effects of different screen dimensions on the intensity of emotional responses since the 1990s (Reeves et al., 1999).
The index of emotional intensity (Emotional Index), however, does not specify which emotion is in progress or which process can generate variations in the recorded values. It is therefore necessary to investigate the implicit psychophysiological responses of people through other indicators.
Designing better experiences with implicit responses
In our research, we have chosen to consider, in addition to the emotional intensity index, the Motivational Index, which reports the degree of pleasantness of the experience.
Two indicators – emotional intensity and pleasantness – which do not go hand in hand but which, when considered in correlation, can provide us with a much more complete set of information. This is because, in fact, an increase in pleasantness does not absolutely correspond to an increase in intensity.
To understand the difference between the two indices, think about all the times you have eaten your favourite dish. On each of these occasions your pleasure level increases, but are you able to remember exactly all these moments? The answer is probably no. Or rather, you may remember having eaten your favourite dish during an important date, but not all the other times you have done the same. This is because the emotional intensity was greater on that special occasion.
Technology, method, skills, and people
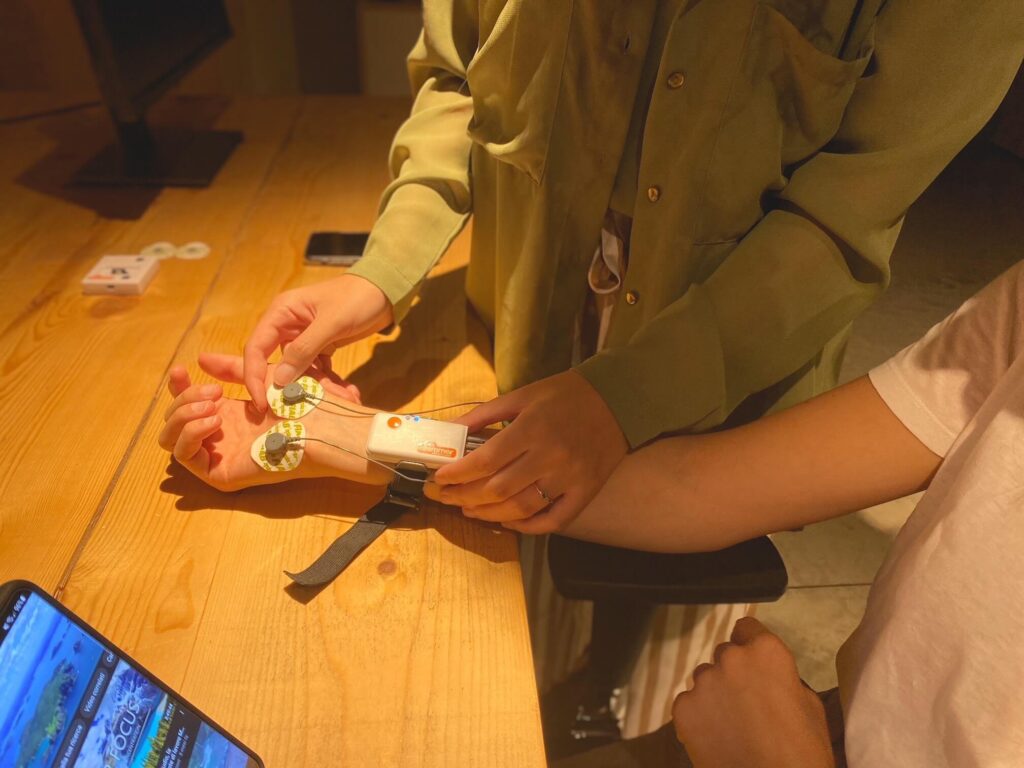
To analyse the correlation between these indices, we asked 24 people (16 women and 8 men, with an average age of 35) to donate their experiences to us. We had each of them individually watch video content from screens of different sizes and, through the use of the Electroencephalogram for the Motivational Index and the Galvanic Skin Response for the Emotional Index, we observed the psychophysiological responses.
The results of our research
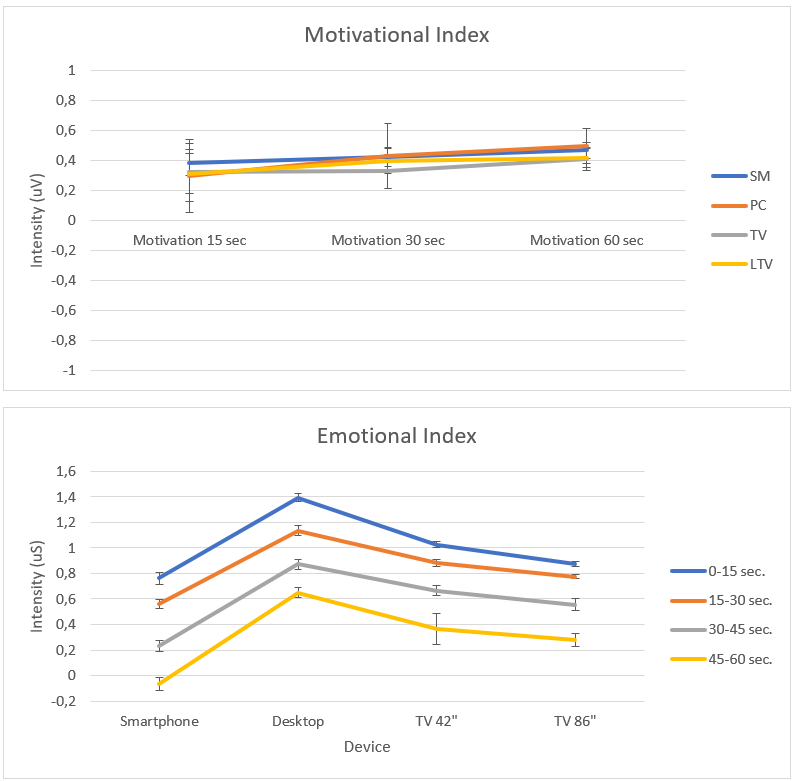
From the analysis of these indices, it emerged that screen size does not affect the pleasantness of the content viewed (Figure 1), but instead influences the emotional intensity (Figure 2). In particular, the main peak is reached in the first 15 seconds of viewing, with a greater involvement (and therefore memorability) while viewing from a Desktop.
However, while literature indicates that the smartphone is the most used type of device to access the internet (93%), this study demonstrates how, when people are reached through a PC monitor, the stimulus is much more likely to be memorized.
In addition, we see how the peak in memorization probability occurs in the first 15 seconds of viewing the video.
Listening to people stories for designing experiences that are beautiful to live
Methodology and technology have enabled our researchers to conduct this research, but once again it is the people who make the difference. Their direct involvement and listening deep to their impressions and perceptions, explicit and implicit, are the key to designing, together with companies, a world of better experiences.