27 February 2023 Valeria Giannelli
Journal of Experiences
Our research on the experience of using social media and how eye behavior varies according to the structure of the channel.
At TSW we ask ourselves questions, it’s part of our DNA: we want to know what’s behind the different experiences, asking the people who live them. In this case we have gone so far as to consider the digital experience on social networks: we have conducted an exploratory research which aims to analyze how much the different structures of the most used social networks affect our way of using them differently.
Colors, posts, contents, advertising, but not only: they are presented on social networks following logics that are sometimes very similar to each other, sometimes characterized by substantial differences, but this choice is not always optimal.
Thanks to the research activity we have carried out, we have understood how to be more efficient on the various channels by monitoring, during an experience test, the eye movement of the participants through an eye tracker, thus identifying the areas of the smartphone screen that catalyze the Attention.
The experience on social networks: the research structure
For this research we involved 16 people (6 men and 10 women) who were asked to explore 4 social networks for a limited time:
- TikTok.
From their structure, three have the same continuous scroll logic (Linkedin – Facebook – Instagram) and one has a scroll logic on the content (TikTok). The order of administration was randomized. While viewing, we recorded eye movements and fixation times (to identify attention focuses) via bar eye tracking.
The results: what we discovered when studying eye movement
From the analysis of the heatmaps (which indicate where people’s eyes have rested within the structure of the social networks) and of the fixation times, we have been able to observe that there is a different eye behavior between the 4 social networks considered, but above all between the three which have the same logic as scroll. But let’s go in order.
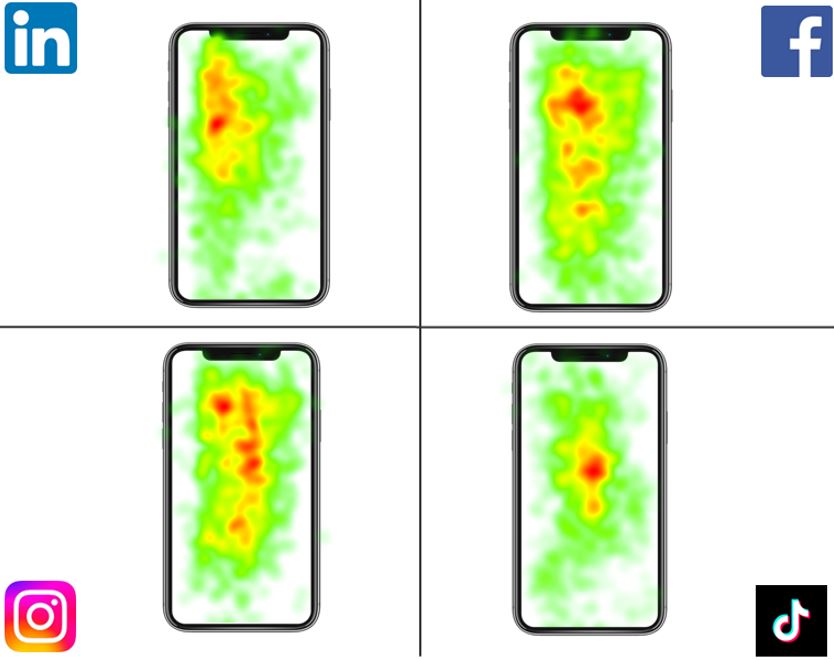
First of all, by comparing the heatmaps obtained from the 4 social channels, a clear diversification emerges in the average ocular concentration of people on the screen for each social network.
Let’s see, then, from this image, how in the three social networks with similar scroll logic, there is precisely a different behavior:
- for Facebook and Instagram eye fixation is concentrated more on the central part
- for LinkedIn, the greatest concentration is on the top left.
Now let’s see some specifics of each channel.
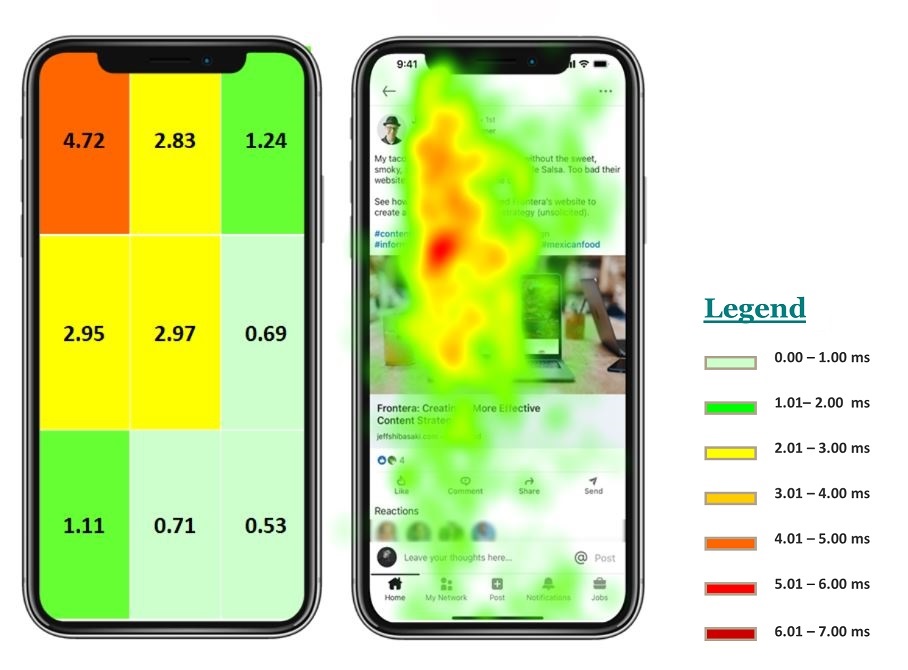
In LinkedIn, we have seen a tendency for people to stay in the upper left part of the smartphone, favoring the adjacent areas. So:
- who posted
- the text content of the post
- The visual of the content.
The navigation icons, positioned in the lower part, perform their functionality requiring minimal necessary attention.
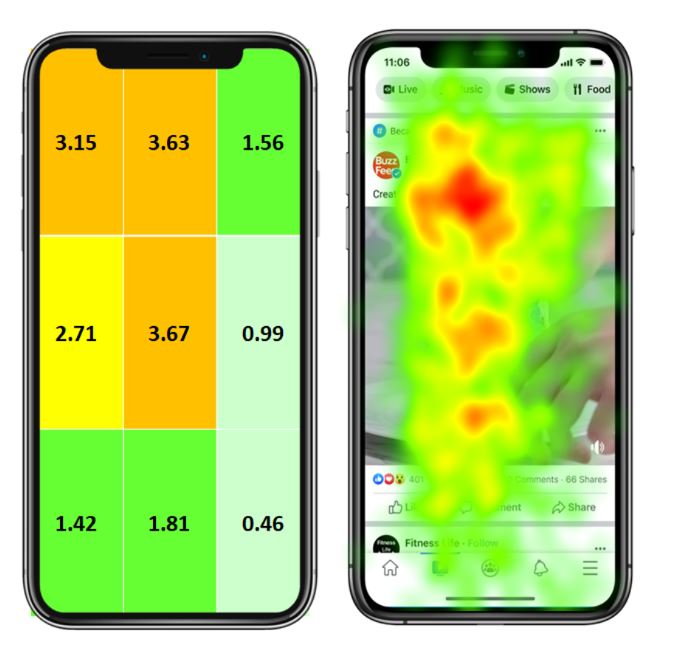
As in Linkedin, also for Facebook we find a concentration in the upper left part, but with a longer fixation time in the central area and widespread eye movements in several areas. In particular, we see how the three quadrants at the top left (the orange ones for instance) have a very similar fixation time starting from the largest in the center and arriving at the top left.
In this case, unlike Linkedin, the image and text capture more attention than the person who posted it. On the other hand, very little interaction on the external right side where information on comments and shares is reported.
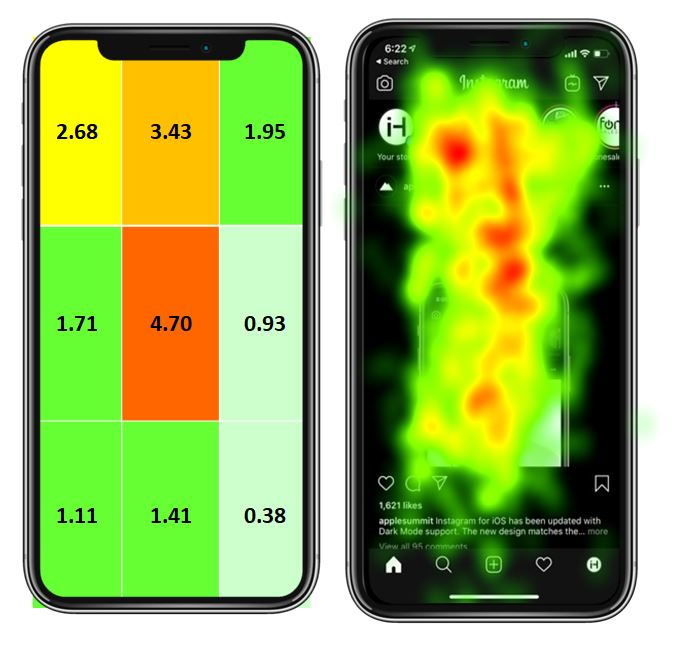
On Instagram, however, the focus of visual attention is concentrated in the central band, then going to climb between the upper part and the left corner. The surrounding bands have a low concentration.
Tik Tok
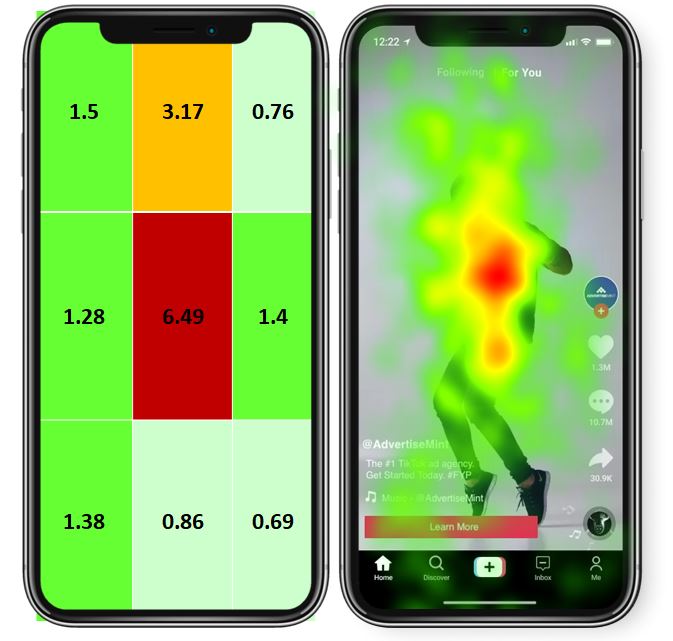
Similarly to Instagram, also on TikTok we find a focus of attention in the central area. A substantial difference are the areas around this point which have a very low degree of ocular concentration except for the upper central part.
How to design a more effective social experience for people
From these data we can therefore conclude that the structure of social networks and the different types of communication influence people’s eye behavior.
This is useful for identifying the best placement of the object we want to draw attention to, for example:
- if we want to push a brand on LinkedIn, the information on which topic we are dealing with will be placed at the top left, therefore in the icon of the publisher, in the name and in the copy.
- regardless of the channel and profile you post (information on which people have paid slightly less attention), it will be the video content that will attract attention and therefore the place where we will go to enter the information we want to communicate.