16 October 2020 Alessandro Venier
Journal of Experiences
Hello! I am a Data Analyst and I deal with listening to people on your websites and apps.
Don’t you believe it? Surely they have told you that we are the ones who tell you “how many sessions we have done this month”, those of Google Analytics, TagManager and long reports full of metrics, sometimes very unclear. Well, once again: hello, I’m a Data Analyst, I listen to people and I send you long (but understandable!) reports.
It’s all true: the data analysis work starts from listening to your users in your digital spaces (websites, social networks, apps, …), an activity possible thanks to the Data Collection services that monitor what happens in these “places” and record the salient aspects in the database that we interrogate every day.
So: the data analyst asks, listens to the answers and returns (even with the help of unusual numbers and metrics) the “voice” of your users to you. Only they, in fact, know what they need, what they love about your site, how much they are interested in certain topics and what they prefer to buy in your online store.
If you have not run away from this page yet (and I will know for sure, looking at the data of our Journal’s pages), I will try to tell you the beauty of our work, the ambiguity of the numbers and why we can help you in your business too.
Data Analysis: what it is and how it is done
The Data Analyst is the professional who deals with inspecting, refining, transforming and modeling data from an archive (database). In practice, however, his role expands and may become (especially within a team) a key partner to help define the KPIs to be measured and monitored, suggest the behaviors to be tracked on the various platforms (data tracking and data collection) and present useful insights to the business, reworking the data through summary indicators, tables, diagrams and infographics (data visualization).
The role of the data analyst, in few words, is essential for analyzing situations, visualizing relationships and giving quantitative weight to events and behaviors, with the aim of providing useful insights to the business to evaluate current and historical performance and make more solid strategic choices and founded.
It is precisely with the idea of bringing more rationality to business choices that the more scientific data analysis professionals have increasingly refined techniques and predictive tools (data mining) and aggregation of large amounts of data from heterogeneous sources (business intelligence) in order to face the most demanding requests of the big international brands.
The scientific model and Kaizen in Data Analysis
Like any strategic activity, Data Analysis also follows defined project flows that allow us to build effective data collection tools and, from these, to obtain coherent, consistent and especially useful data.
The structure that best represents the methodology that a data analyst follows is the cyclical one of the scientific method: following the observation of the “world”, we ask ourselves questions that we try to answer with appropriate tools and analyses. Further questions arise from these answers, in an ever-changing process.
What does this have to do with Google Analytics? A lot!
The Data Analyst receives a request (or a question) from the customer from which the actual “research” begins, for example:
“Is my site effective in attracting and satisfying my customers?”.
From this point on, the “scientific” design flow begins: the behaviors and metrics to be detected and measured are planned, the necessary data are defined, their collection and analysis are carried out and the results are presented in a clear and synthetic way. From this point on, the process begins again with a view to expanding demand, continuous monitoring and constant improvement of the methodology and tools used, recalling the Japanese philosophy of kaizen (gradual and continuous improvement).
If I’ve convinced you, let’s review the main moments of this process, to better understand the typical day of our Data Analyst.
The phases of Data Analysis: what does a Data Analyst do?
As anticipated, data analysis is not just analyzing data and reporting but participating in a broader and more strategic planning flow of listening, understanding and communication.
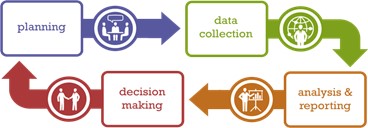
Let’s see together the different steps of the Data Analysis:
- Planning: is the first phase that involves understanding the customer’s need, choosing the metrics, attributes and behaviors to be detected and defining the tools needed to record and collect this data. Each research begins with one or more questions and it is precisely in this phase that we try to understand the real client’s needs that must be translated into clear, detectable and consistent digital elements: the data that represent the actions and choices of your online users. To do this, you can rely on an existing data collection infrastructure, evaluating any necessary changes, or you can plan the construction from scratch of an ad hoc tracking system.
- Data Collection: once you have defined what you want to record, which tools to use and set the tracking and data collection environment, the most delicate phase begins: listening to users. The data collection phase may seem the most passive, in reality it is the most insidious since several problems can occur, often not resolvable afterwards. For example, the data may not be recorded correctly (due to technical or setting problems) or new variables may be inserted in the course of work for which a prompt reorganization of the tracking and data collection is required. It is also possible that one realizes in itinere that the data collected is too concise or too detailed, an eventuality that can lead, in a subsequent phase, to problems of deepening or understanding the big picture. For these (and several other) reasons, continuous monitoring is necessary at this stage to immediately identify possible margins for improvement in data collection.
- Analysis and Reporting: after the data collection, the data is filtered, sorted, compared, analyzed and / or aggregated to answer the initial questions and a numerical value is given to the metrics requested by the customer. The process is not linear: there are often more ways to explain a behavior or to evaluate digital performance and it is therefore necessary to verify what is the best data to tell what is happening in the world of users. The analysis ends with the commented collection of the data extracted and processed in the report, the document that illustrates and summarizes with descriptions, tables, graphs and summary indicators (data visualization) the entire process of Data Analysis carried out up to now.
But remember: a good Data Analyst will hardly give you solutions, he will rather show you ways, hints, ideas, patterns, useful behaviors to understand your users a little more! - Communication and Action (Decision Making): the last phase of the data analysis cycle involves communicating the analysis results to the customer and answering the questions that have moved it. It is important, at this stage, to give context and priority to the illustrated data, in order to indicate to the client the right way to read the data, which is essential in order to make consistent and solid business choices. As I often tell our customers, the numerical data is neutral, it is neither positive nor negative. We are the ones who give it the right (or wrong) attribution based on how we contextualize it and support it with other evidence. It is in this delicate balance that the true contribution of a professional is recognized.
- Constant improvement (Planning again): once a flow has been concluded, the analysis comes to life with other questions that in turn require planning, data collection and other analyses, according to a potentially infinite positive circle. The ultimate goal of this type of methodology is to refine the used tools, improve the collection and analysis of data and raise customer’s awareness of listening to its users in a proactive and collaborative way.
The most used tools for Data Analysis
Data Analysis, as we have seen, goes through several steps that in turn require ad hoc tools and services to meet specific needs. The tools available to a Data Analyst are many and continuously updated and integrated, for this reason we will present the ones that we use most often at TSW to give an overview.
- Tracing: this phase requires you to insert portions of code and / or scripts within the platform to be monitored. In some cases it is easier to intervene manually, adding pixels and tags directly from FTP and / or CMS, in others it is more advantageous to make use of a Tag manager such as Google TagManager. With this service (free) it is possible to organize all the pixels and tags even without having programming knowledge through a clear and simplified user interface. After entering a master tracking code, it is possible, in fact, to set rules and customize the tracking without having to request further intervention from the developer (except for some more advanced tracking).
- Data Collection: set the tracking, the data is stored in a database, in some cases not before being filtered, organized and (sometimes) modified. The most popular service is Google Analytics, available both in the free version and with a subscription for more advanced on-demand features (Analytics 360). Other noteworthy services (as needed) are: Adobe Analytics, WebTrekk, the panels of the various online advertising and social management services, MouseFlow and many more.
- Data Analysis: the stored data can be sorted, filtered and aggregated by these same data collection services, however it may be necessary to resort to additional software. Among the many possibilities we point out the dear and old Microsoft Excel, also essential for data cleaning, for Pivot tables and more, and premium Business Intelligence services such as Microsoft PowerBi, a powerful software for aggregating data from different sources, processing (including advanced) and their return in dynamic visual format. Other more advanced tools can allow greater depth of data extraction, analysis and forecasting, as in the case of R, for statistical processing, and Python, for running scripts and advanced operations.
- Data Visualization: the phase of representation of the numeric data in visual form can take place both through static and dynamic infographics.
- The starting tools to begin with static data visualization are the classic Microsoft Excel and PowerPoint, ideal for building and updating periodic reports. In addition to the aforementioned PowerBi, there are also many other proposals, such as Google Analytics itself and its “partner” Google DataStudio, a free solution that allows you to generate dynamic dashboards starting from data provided by different databases.
- Dashboarding (and all dynamic reporting) is in our opinion a great opportunity for client and consultant, as it saves time in the compilation of static reports in favor of a dynamic and efficient tool (which requires, on the other hand, some initial investment in the setup phase). With a dashboard it is, in fact, possible to request data in different time intervals, with filters and sorts and with dynamic views, all on-demand, with obvious advantages in terms of time and flexibility.
Data Analyst: because consulting a professional is an investment for your business
It has been said in every way that listening to customers is essential to develop your business and add value to your brand. Going in the opposite direction involves going blindly, according to hypotheses, not facts
Data analysis becomes, in this sense, one of the available possibilities to the business to detect and fully understand the user experience in the digital world (and beyond). However, it is not enough to install the Google Analytics pixel and look at a monthly chart: as I have already told you, the data does not speak for itself! Professional advice is required that works closely with the end customer and with all the teams (or agencies) that revolve around the broader marketing project. Only in this synergy between users, operational areas and strategic areas the real quality leap offered by Data Analysis takes place.
Seeing is believing!